This website uses cookies so that we can provide you with the best user experience possible. Cookie information is stored in your browser and performs functions such as recognising you when you return to our website and helping our team to understand which sections of the website you find most interesting and useful.

Category:
Artificial Intelligence
Industry:
Biotechnology
Client
Our client is a global technology group with years of experience designing solutions for industrial and laboratory applications. The company specializes in liquid handling technologies, such as pumps and dosing systems, used across the chemical, pharmaceutical, food, water/wastewater, and environmental sectors.
Challenge
In one of its R&D projects, the company focused on optimizing signal analysis for a device measuring nitrogen content in solid samples. A critical challenge was accurate peak detection — identifying signal points that correspond to, for example, the presence of nitrogen in a tested sample.
Previously, the process required manual configuration of multiple parameters, such as:
- peak height threshold
- minimum width
- peak-to-peak distance
- noise sensitivity
- baseline limits
This manual approach caused several issues:
- High entry barrier – only experienced operators could correctly set all parameters
- Lack of repeatability – analysis results varied by user and configuration
- Slow analysis – manual tuning could take several minutes per signal
- Error sensitivity – even small parameter changes could significantly affect outcomes
- Poor scalability – difficult to ensure measurement consistency across devices and locations
The goal of the Proof of Concept (PoC) was to develop an algorithm that works fully automatically, requires no user tuning, and runs directly on client-side edge devices (e.g., Raspberry Pi) while maintaining high precision and operational stability.
Solution
The project team designed a complete peak detection algorithm based on signal analysis logic, optimized to run on devices with limited computational resources.
Data and Methodology
The project utilized real data from the client’s chemical detectors, collected during nitrogen content analysis. The dataset included:
- raw signals (with noise and baseline drift),
- denoised signals pre-processed by the client’s team,
- manually annotated reference data, including peak start/end indexes and area under the curve.
The data was delivered in three stages, enabling fast development and validation:
- Unlabeled set – for visual analysis and signal dynamics understanding
- Small labeled set – for testing initial detection rules
- Full labeled set – for final validation
This data organization allowed iterative development every few days, with real-time validation by the client’s domain experts.
Technical Approach
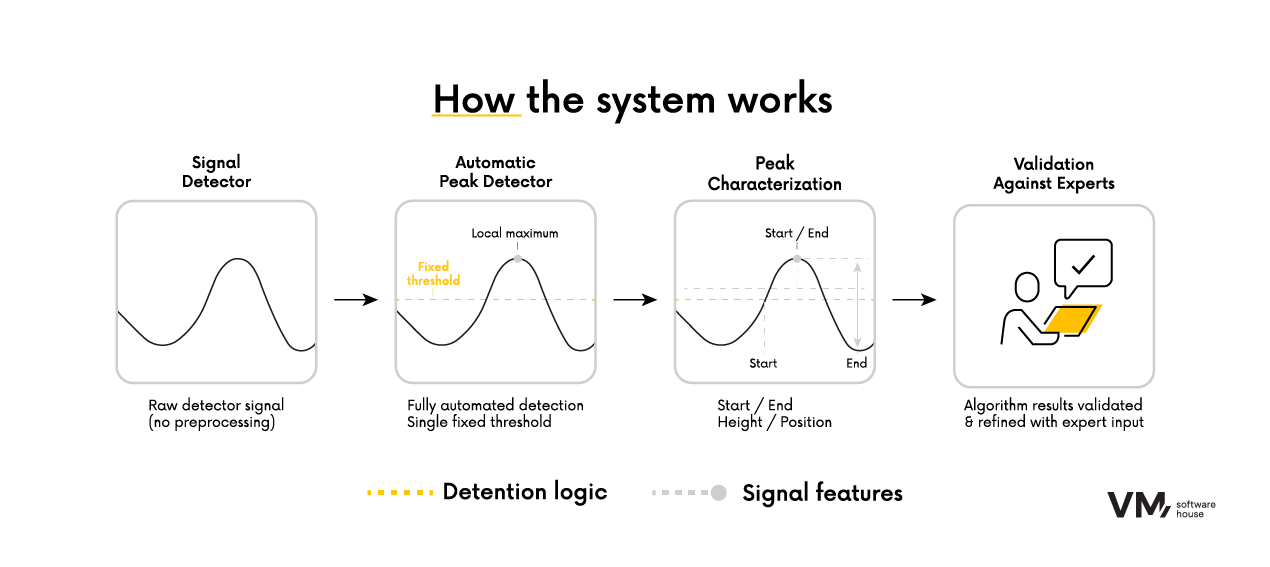
- The algorithm runs on raw input signals without any preprocessing — filtering, baseline correction, or normalization was intentionally omitted.
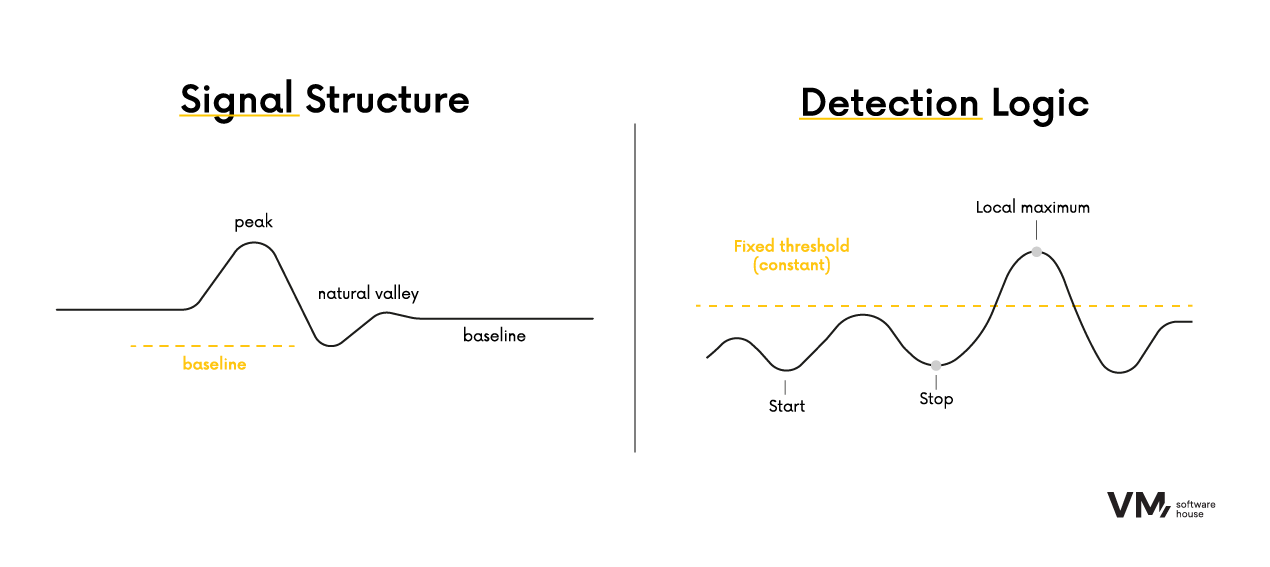
- Local maxima detection – peaks are detected as points higher than their neighbors; for flat tops, the central point is selected.
- Fixed detection threshold – a constant value (e.g., 0) was used for all signals, simplifying logic and increasing repeatability.
- Peak prominence – calculated as the difference between peak height and the highest of its two bases (left/right), enabling accurate boundary estimation.
- Two boundary modes – a classic mode (shared baseline) and a side-aware mode (separate left/right baselines) for improved precision in complex cases.
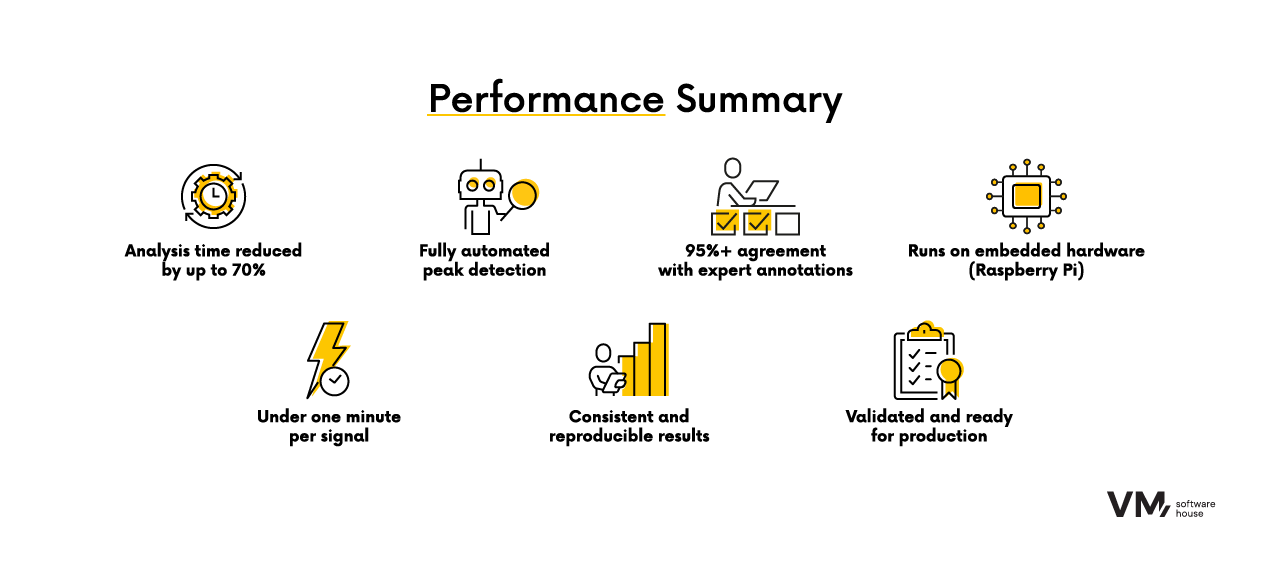
- Minimal hardware requirements – all calculations complete in under 60 seconds per signal on a Raspberry Pi device.
Results
- Simplified device operation – full algorithm automation enables use by non-experts without deep knowledge of physics or chemical analysis, broadening accessibility in less industrialized markets or resource-limited settings.
- Market expansion – lowering the skill barrier allows the client’s devices to be deployed in new segments and regions, unlocking sales in previously unviable territories.
- 100% automation – the detection algorithm operates autonomously with no user configuration, reducing human error and standardizing results.
- Expert-level precision – peak boundaries matched expert annotations in over 95% of cases, validating the algorithm’s suitability for lab and industrial applications.
- Efficient processing – signal analysis completed in under one minute on Raspberry Pi with stable runtime performance.
- Up to 70% faster analysis – eliminating manual parameter tuning significantly reduced total processing time compared to legacy methods.
- Production-ready – the system is ready for integration with the client’s software and can be extended with adaptive thresholding or complex signal handling.

How Downtime Was Reduced and Efficiency Boosted in Just 3 Months—Without Interfering with the Production Line
Design, Development, DevOps or Cloud – which team do you need to speed up work on your projects?
Chat with your consultation partners to see if we are a good match.