


 AI/ML
AI/ML  Software Development


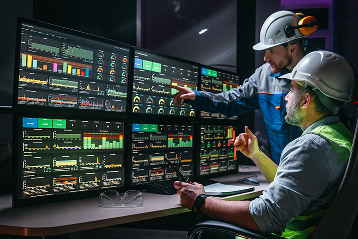
Monitoring Tool & Predictive Maintenance
A new standard that enables you to prevent, not just react
Why does this solution matter?
Instead of reacting after a failure, you can prevent it
Up until now, maintenance was reactive: a machine would fail, production would halt, and the team would analyze the causes and look for a fix.
Monitoring Tool reverses this pattern. By monitoring and analyzing real-time data, you can detect early warning signs and plan service actions before they affect production. This elevates technical data—such as vibration, voltage, and temperature—from mere archival logs to predictive and planning tools that support stable, efficient production. This is the essence of Predictive Maintenance: data analysis helps identify patterns—performance drops, vibrations, overheating, or elevated voltage—and advises which components require attention before they cause downtime. That way, you perform servicing exactly when needed—avoiding costly surprises.With Monitoring Tool, you can:
set customized warning and alert thresholds,
monitor which parts wear out faster and under what conditions,
plan maintenance and component replacements at the optimal time,
reduce the risk of unplanned downtime and shorten response time.
What challenges are manufacturing companies facing today?

Lack of real-time data access
70% of companies don’t use real-time machine data, leading to delayed decision-making.

Time-consuming reporting
Manually preparing reports extends the analysis process by up to 40%, burdening technical teams.

Scattered information
Machine, sensor, and IT system data are siloed, making it difficult to identify root causes and correlations.

Unplanned downtime
Unplanned downtime can cost up to 10 times more than scheduled maintenance. Without predictive capabilities, companies waste time and resources on unpredictable repairs.

How does Monitoring Tool solve these problems?
Complete production overview
Data from machines, sensors, and systems is centralized—giving you a clear, consolidated view of operations.
Data-driven decisions
Real-time and historical readings enable teams to make informed technical decisions—no guesswork required.
Act before the problem escalates
The system triggers alerts at the first sign of deviation, allowing maintenance to be scheduled proactively.
Flexible architecture
Start with a single dashboard and scale the system across lines, plants, or locations.
Seamless integration
Monitoring Tool uses OPC Gateway—no PLC interference or costly infrastructure changes needed.
IT stability and security
The solution runs on-premises or in the cloud, aligning with your company’s security policies.
What does the implementation process look like?

We select machines and key parameters, build the first dashboard, and demonstrate the system with real production data.
We set up views and alerts, and train your team to work independently with the tool.


We expand the solution to additional machines and lines, integrating it with ERP, CMMS, or quality systems.
We support you in building predictive models and evolving the system to match your company’s needs.

What do you gain by working with us?
- Real-time access to data – no more delays from manual reports.
- A solution tailored to your factory’s actual conditions.
- Automated analysis and reporting – faster response times.
- Reduced maintenance costs through planned servicing.
- A stable, scalable architecture ready for further automation.
- Technical and strategic support – at every stage of the project.

Where is Monitoring Tool & Predictive Maintenance used?

Manufacturing sites with assembly lines and CNC machines

Automotive, aerospace, and heavy industries

Energy and FMCG sectors
Companies investing in predictive maintenance and digital transformation
Series production where consistency and quality are critical